VIEWING THE DATA
You’ve seen in the last few postings how to find, import and use GIS data with MySQL. But, the ‘G’ in geographical includes GRAPHIC and a little eye candy never hearts your understanding of the curves.
Everyone knows of map.google.com. Mark McClure has a great site explaining the use of Google’s APIs. He explains how to generate interactive maps with labels for places and routes indicating driving directions. Many of Mark’s example explain exactly the sorts of things I’ve wanted to do with maps for years. Like Cycling routes on Google Maps.

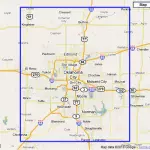
Using the GPS in my iPhone as a starting point, I created a set GIS points known as a bounding box.
 -98 36
 -97 36
 -97 35
 -98 35
 -98 36
I tested these with Mark’s EncodePolyline example by pasting them into the input box, pressing the lng/lat radio button and then the Show Map button.
I used Google’s PHP example code and the SQL query in “Part 4” to create a plot the school locations I created with the SQL above.
Besides Google’s online mapping API there are many good programs designed to both display and help you create your own GIS data points and shapes. You can use Google’s Google Earth application with it’s APIs to display your data.
Quantum GIS (QGIS) is a user friendly Open Source Geographic Information System (GIS) that runs on Linux, Unix, Mac OSX, and Windows. QGIS supports vector, raster, and database formats. QGIS is licensed under the GNU Public License. This application is VERY POWERFUL and requires a powerful computer to run it. MapWindow is a freely available and simple to use, yet powerful, Geographic Information System. MapWindow is a Windows open source project. This application is FAST on the Windows platform. For new GIS users it is good place to start. OpenEV is an open source library and reference application for viewing and analyzing raster and vector geospatial data. It uses the GDAL library to display georeferenced images and elevation data. The application also has image editing capabilities and uses OpenGL to display elevation data in three-dimensions. This is also the utility used in the book Web Mapping Illustrated.
I’m going to let you explore these programs and determine if any are useful. This series of posts is really about MySQL and GIS.
In next next posts:

Tweet


 LinkedIn
 Twitter

Nice to see that you follow the same way as I do in the past months when I wanted to display polygons stored in MySQL on a googlemaps window. I said myself: i must post something… ;-)
The only thing that’s disappoint me while using MySQL for GIS operations is the poor spatial functions available. MBRcontains for example. I hope a true “contains” function will be integrated in the v6… Will it be done with Oracle on the scene?
Link | October 20th, 2010 at 3:36 am
Thanks for the post dear. QGIS is an ultimate open source. I have used it but in starting I faced many issues but now I am comfortable with it. If you need any help regarding Sales territory mapping then we will be glad to serve you.
Link | November 9th, 2010 at 4:55 am